Address
Building A1, Runteng Industrial Park, No. 4 Xishan Road, Longteng Community, Shiyan Subdistrict, Bao'an District, Shenzhen 518000, China
Work Hours
Monday to Saturday: 09:00 – 23:00 (UTC+8)
Sunday: closed
Address
Building A1, Runteng Industrial Park, No. 4 Xishan Road, Longteng Community, Shiyan Subdistrict, Bao'an District, Shenzhen 518000, China
Work Hours
Monday to Saturday: 09:00 – 23:00 (UTC+8)
Sunday: closed

A measured comparison of throughput, quality and labour between manual, semi-automatic and automatic lens feeding, with arithmetic you can check on your own line.
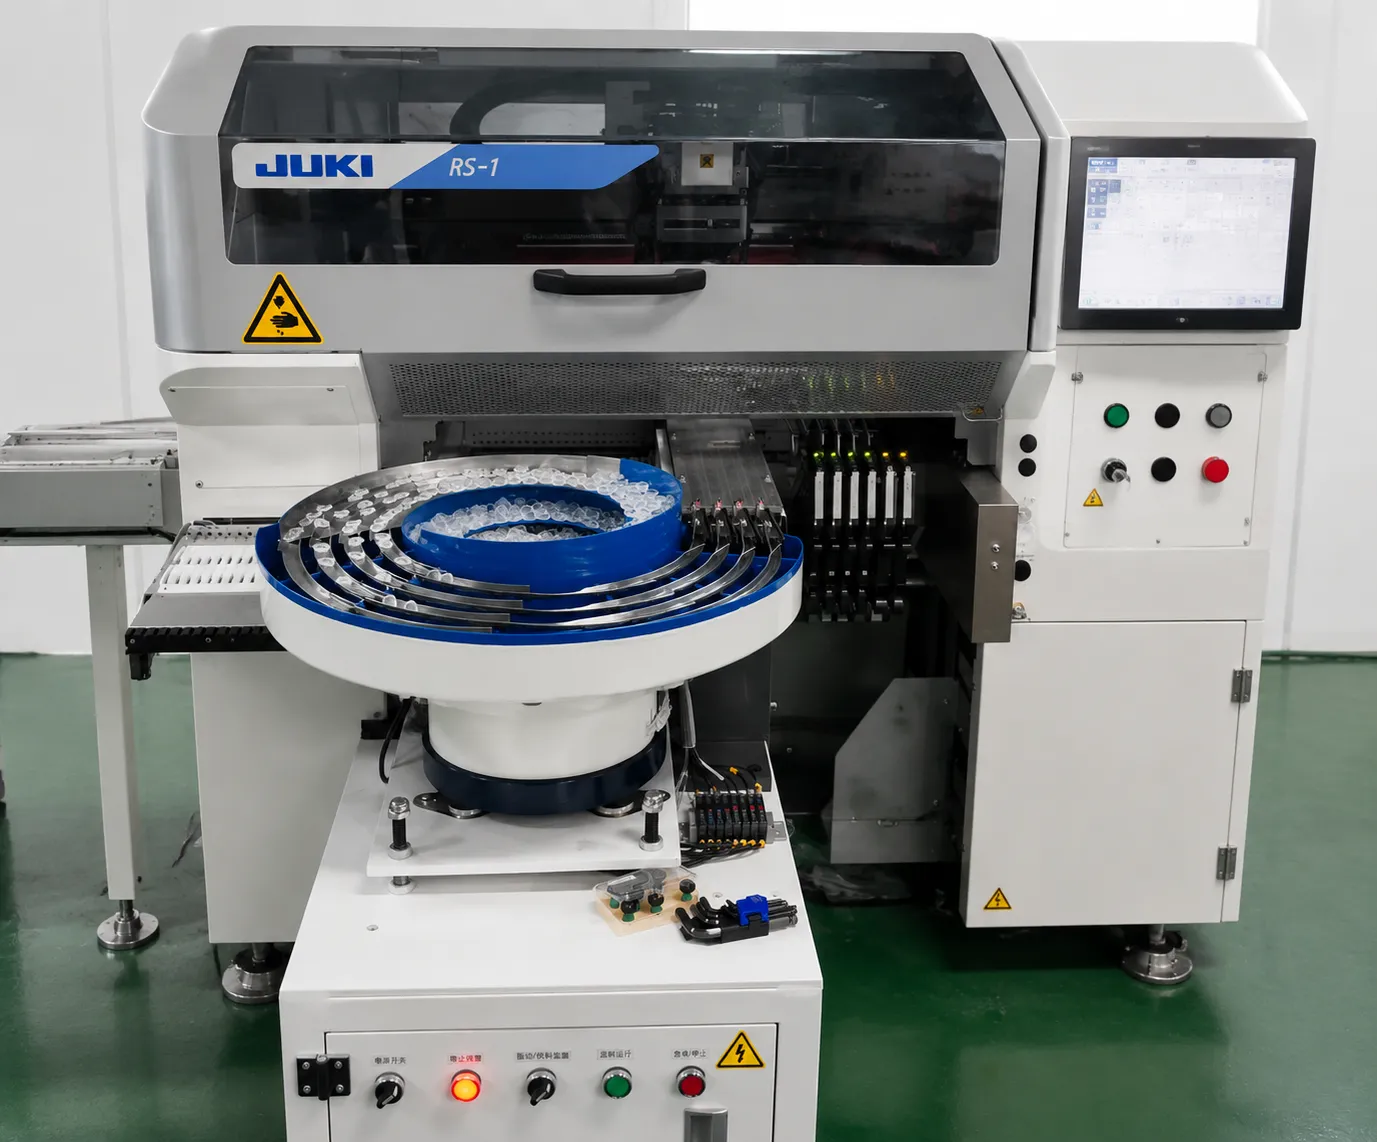
A measured comparison of throughput, quality, labor and payback between manual, semi-automatic and automatic lens feeding, with the arithmetic you can check on your own line before you buy.
Manual feeding looks free because there is no machine on the invoice. The money leaves through four other doors, and three of them never appear on a cost sheet.
A trained operator picks lenses one at a time and places them in an orientation nest. Published bench data for this page’s comparison puts the achievable rate at 800–1,200 UPH per person, with 5–15% of lenses rejected for jams, scratches or wrong orientation. The rejection figure is not steady: it drifts with shift, fatigue and lens batch, and night shifts typically run 40% higher rejection than day shifts on the same part.
Add those lines together and the visible cost — wages plus scrapped lenses — accounts for only about 30–40% of what manual feeding actually costs.
The same eight cost lines, priced on a manual station and on a DPS-2 station. The point of the table is that the visible line — wages — is not the largest one.
| Cost line | Manual station | DPS-2 station |
|---|---|---|
| Direct labor | 2–3 operators per line, wages at your loaded rate | 1 operator supervises four or more machines |
| Scrap and material loss | 5–15% of lenses rejected, plus the material already consumed | Rejection below 0.5%, so material loss approaches the process floor |
| Rework labor | Every misaligned lens found later and corrected by hand | Orientation controlled upstream of the placement head |
| Micro-stoppages | Restarts, refills and corrections that never reach a downtime log | Continuous feed with jam recovery per channel |
| Inspection load | Higher incoming rejection flags more parts at AOI | Stable input reduces false calls and re-inspection |
| Customer returns | Escaped defects returned with freight and warranty exposure | Rejection controlled at the source rather than at final test |
| Equipment cost | No machine, but no capacity ceiling either | From a base figure that scale with channel count and options |
| Ramp-up and training | 2–4 weeks before a new operator reaches rate | 1–3 days of training on the HMI |
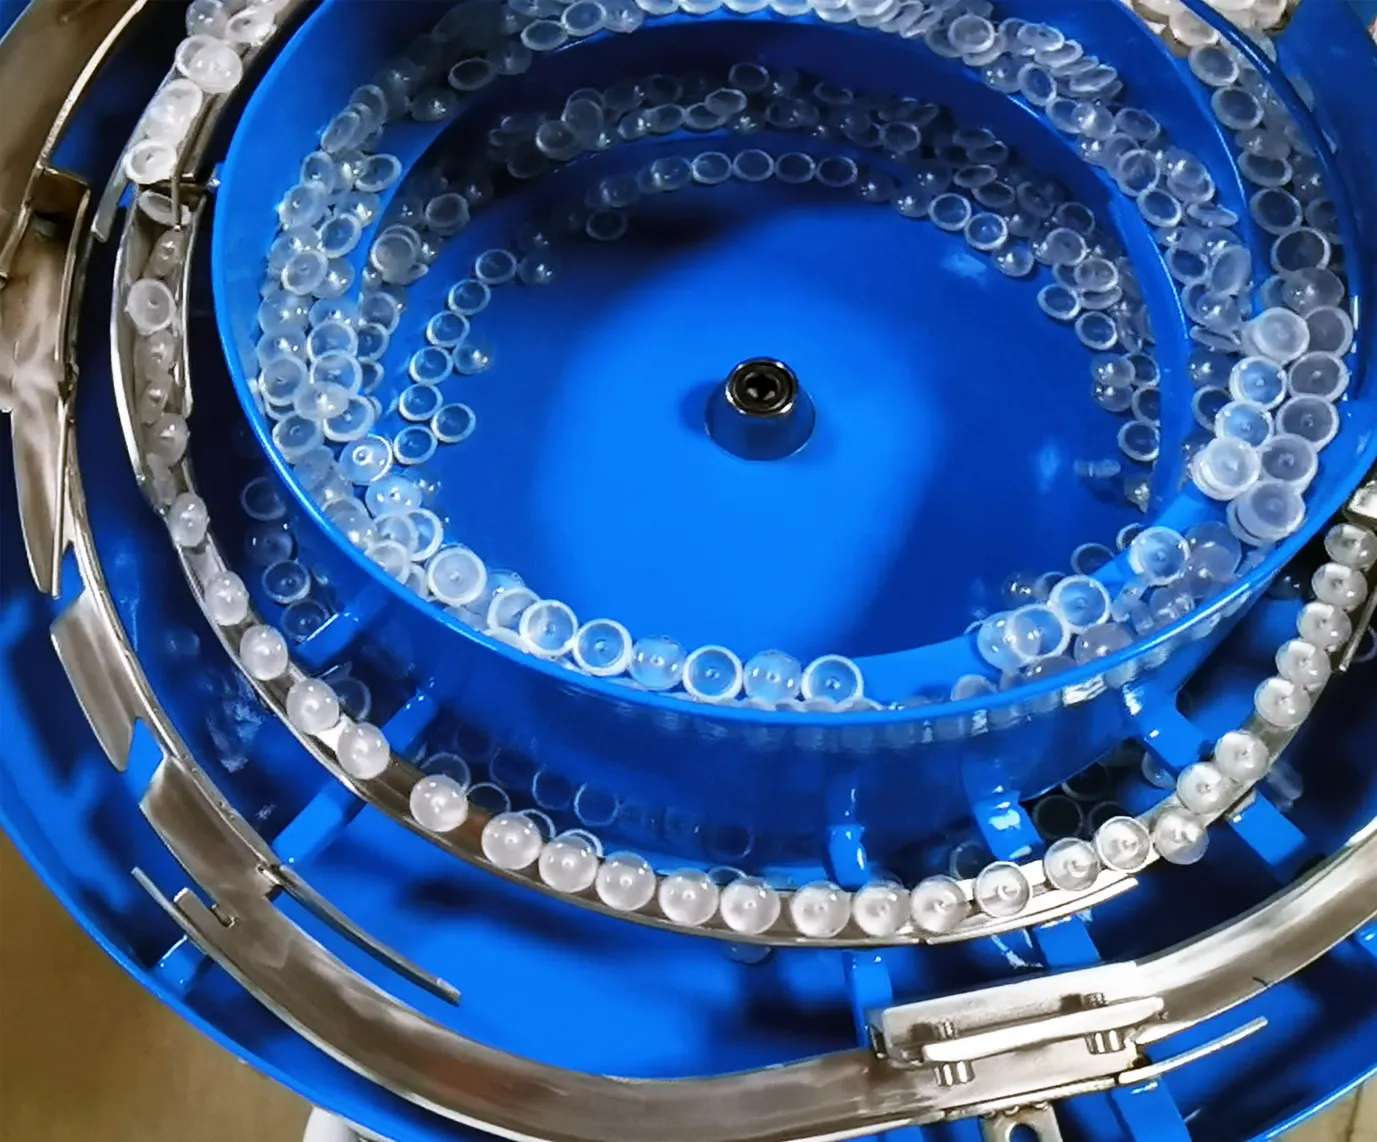
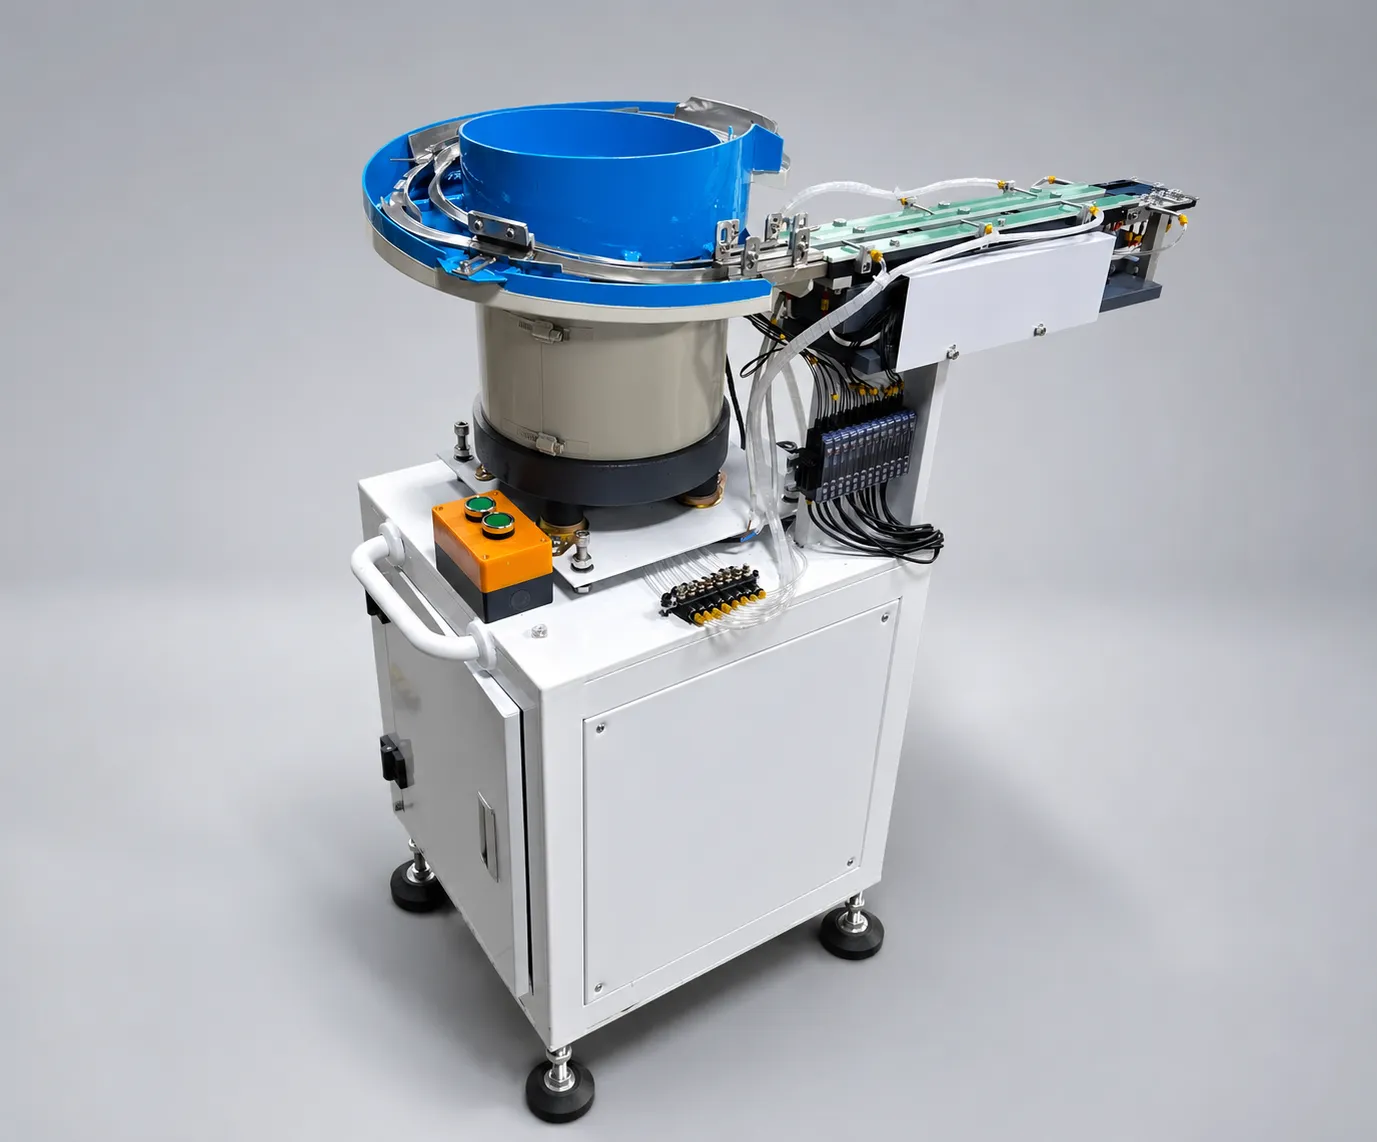
The JHIMS DPS-2 feeds lenses from a vibratory bowl with patented dual-frequency drive, stabilized by closed-loop control, so the part arrives at the pickup point at the same rate whether it is the first hour of the day shift or the last hour of the night shift.
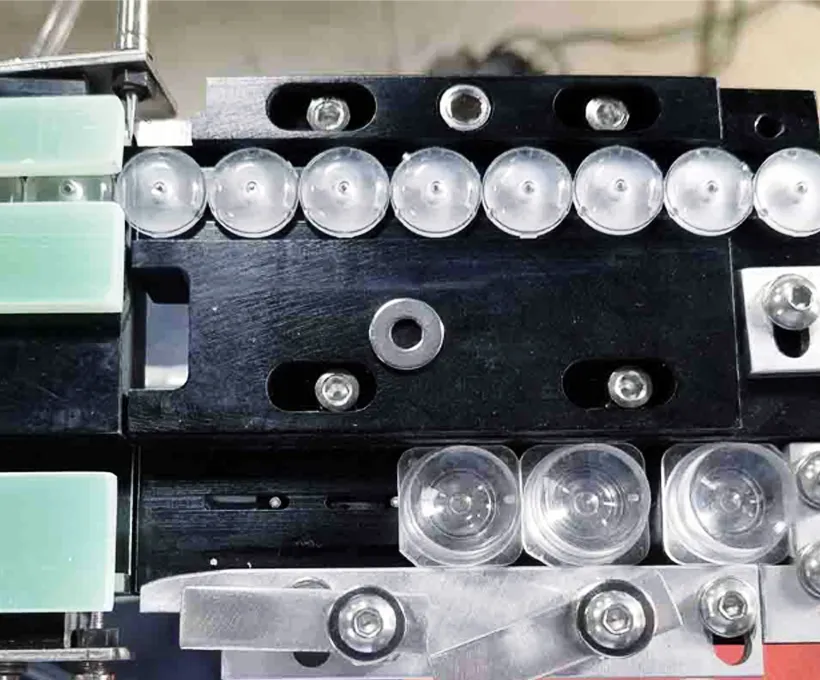
The table below is the comparison we use with customers during a feasibility review. Figures are typical values from JHIMS engineering data and customer lines; treat them as a starting point and verify against your own lenses with a sample test.
| Metric | Manual Feeding | Semi-Automatic | JHIMS DPS-2 |
|---|---|---|---|
| UPH (lenses per hour) | 800–1,200 | 1,500–2,500 | 3,600–7,200 |
| Rejection rate | 5–15% | 2–5% | Under 0.5% |
| Operators per Line | 2–3 | 1–2 | 1 per 4+ machines |
| Changeover time | 15–30 min | 10–20 min | Under 5 min |
| Shift-to-shift variation | ±30–40% | ±15–25% | Under 3% |
| Operator training | 2–4 weeks | 1–2 weeks | 1–3 days |
| Annual Labor Cost (1 shift) | $15K–$25K | $8K–$14K | $3K–$5K |
| Equipment cost | $0 (labor only) | $4K–$7K | From ~$6,000 base, configurable |
| Typical Payback | Not applicable | 12–24 months | 6–11 months |
| 5-year cost estimate | $90K–$180K | $45K–$70K | $22K–$30K |
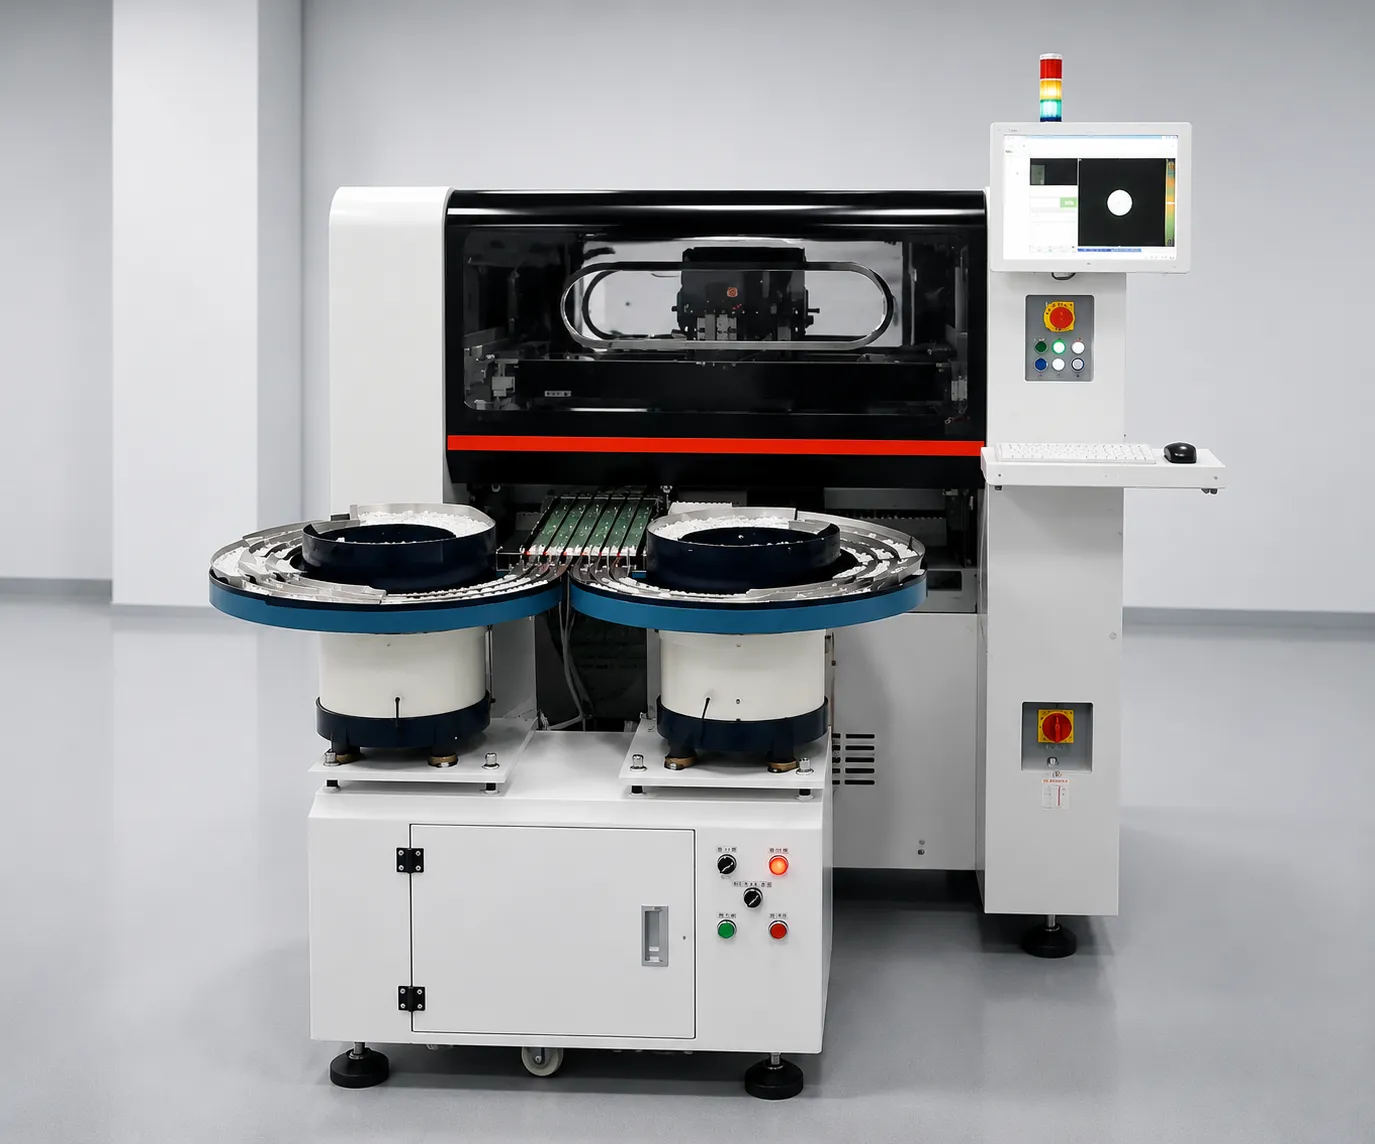
The retired online calculator on this page asked for nine inputs. Four of them carry almost all of the decision, so you can run the arithmetic on a whiteboard:
Two variables swing the answer more than anything else: lens value (a $2 lens makes rejection ten times more expensive than a $0.20 lens) and shift structure (two shifts roughly double the labor saving without doubling the machine cost).
Every figure on this page traces back to two sources: JHIMS engineering measurements on the DPS-2 platform (feed rate, rejection, orientation consistency, changeover time) and documented customer data from installed lines in LED lighting, automotive electronics, medical optics and consumer electronics manufacturing.
You do not have to take them on trust. Send 500–800 of your own lenses and we run a free 48-hour feeding test, then return a report with measured feed rate, rejection breakdown and a video of your lenses running — plus the time-series data behind it. If the numbers do not hold on your part, that is worth knowing before you place an order.
The distinction that matters when you read this page is between a measured value and a transferred value. A measured value comes from the specific lens, track and tooling combination that produced it; a transferred value is a figure borrowed from a similar application and assumed to hold on yours.
Feed rate and rejection are measured values, and they are the two numbers that decide a business case — which is why we quote them per channel rather than per machine and why the sample test uses your part. Customer data here comes from installed lines in LED lighting, automotive electronics, medical optics and consumer electronics, each starting from a different baseline.
Verifying the numbers should be possible without trusting the supplier of them. Ask for the raw structure of any claim: a feed rate per channel over a timed shift, a rejection count with the cause categories, and the lens and tooling that produced them.
The DPS-2 logs feed rate and rejection as line data, so the same measurements can be repeated after installation and compared with the sample report rather than a brochure. If a supplier can produce measurements but not the conditions behind them, treat the figure as a claim; if they can produce neither, treat the claim as absent.
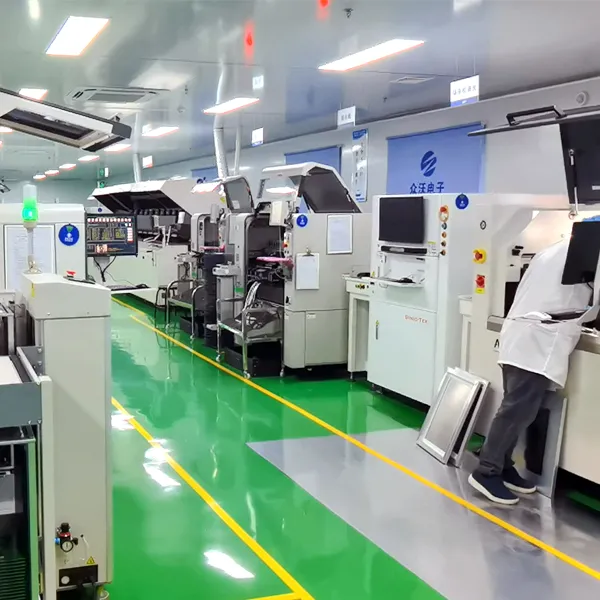
Before automating, confirm which symptom you are actually paying for. Each symptom on the left points to a different measurement, and the measurement decides whether a feeder is the right spend.
| Symptom on the line | What it usually means | What to measure first |
|---|---|---|
| Placement machine waits between cycles | Feeding rate below machine consumption | Lens consumption per hour against achieved feed rate |
| Rejection climbs on the night shift | Fatigue-dependent orientation and handling | Rejection by shift on the same lens and tooling |
| AOI false calls rising | Incoming orientation and contamination variability | Rejection by cause at the feeding step |
| Setup time eating the shift | Manual re-tooling per lens type | Number of changes per week and minutes per change |
| Operator count growing with volume | Feeding labor scales linearly with output | Fully loaded labor per line per month |
| Scrap cost exceeding labor cost | Lens unit value is the dominant loss | Lenses per month multiplied by rejection multiplied by lens cost |
| Contamination complaints from customers | Handling between tray and nest | Defect categories at final test and at customer return |
| Volume too low to justify capital | No constraint that automation removes | Monthly lens volume, shift pattern and customer quality requirements |
| Product mix changes faster than tooling amortises | Tooling cost per type exceeds the volume it serves | Pieces per lens type before the next design change |
Automatic feeding is a line decision, not a machine decision. Before quoting, check these six points with your process engineer:
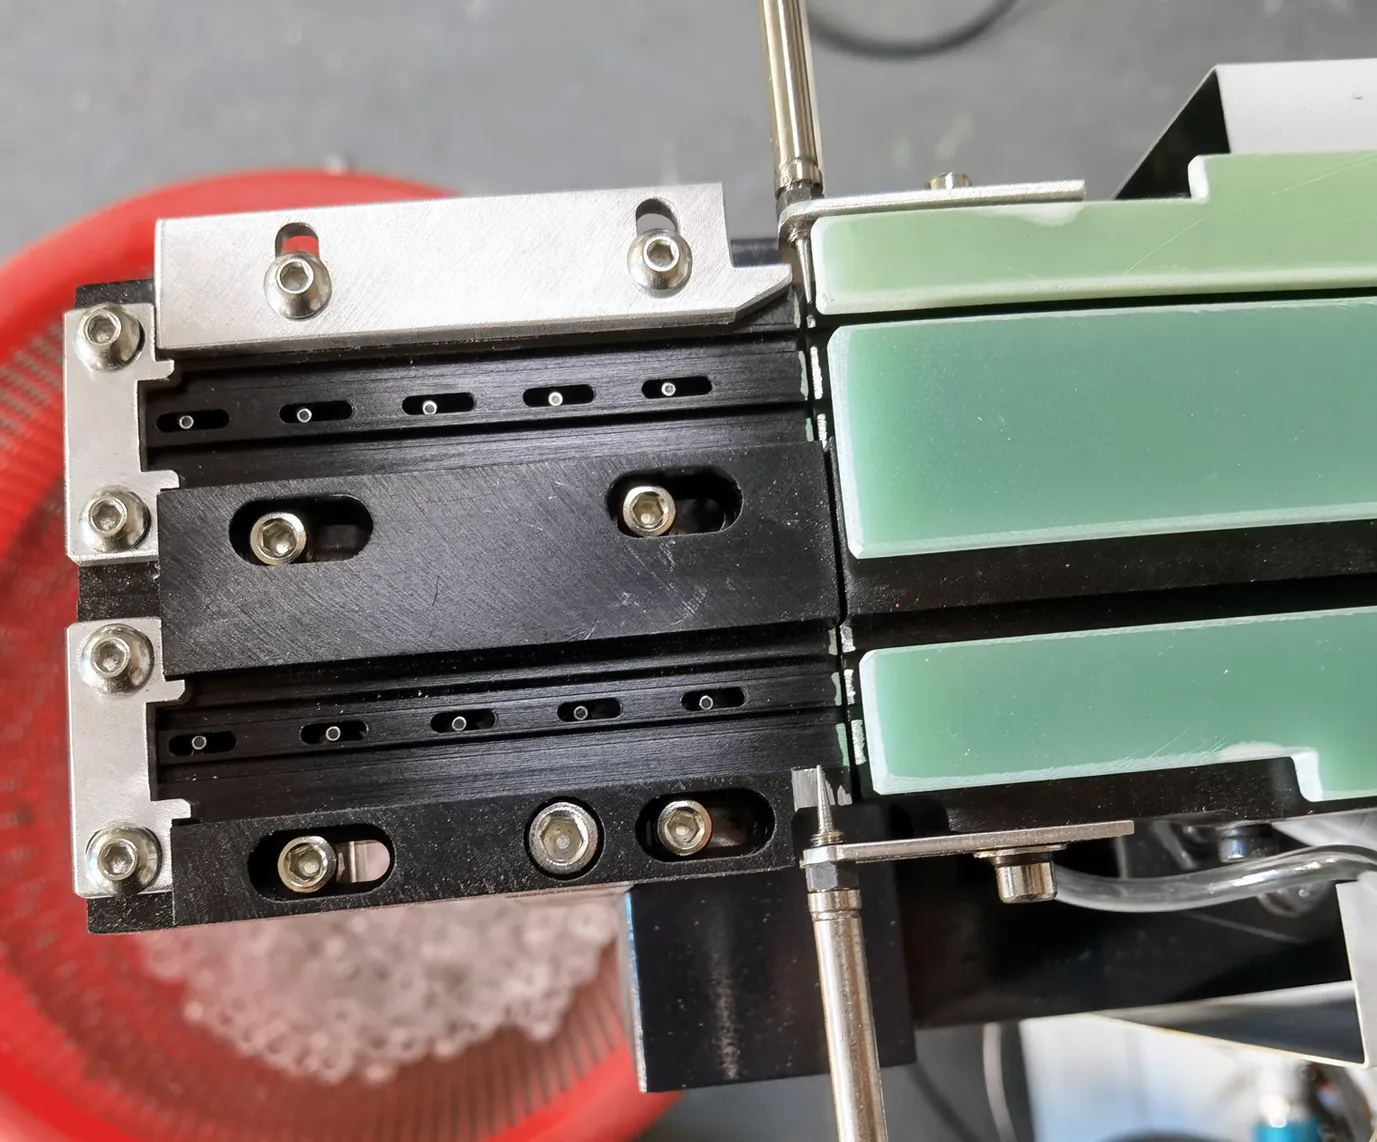
The fastest way to settle the manual-versus-automatic question on your line is to stop estimating and measure. Send 500–800 lenses for a free 48-hour feeding test and you get a documented report with measured feed rate, rejection breakdown and orientation consistency — the same data we use for a payback estimate.
If you want the technical background first, read how the dual-frequency architecture delivers stable feeding, or review the full DPS-2 specifications. To talk through your shift structure, lens cost and expected volume, message a JHIMS engineer on WhatsApp — typical reply within a few hours.
What arrives after a sample test is a document you can act on: the measured feed rate on your lenses, the rejection count with its cause breakdown — orientation, jams, surface marking — the orientation consistency at the pick-up point, and video of the run so the mechanism can be inspected rather than described.
Because the test also informs the configuration, the report comes back with a channel count and a tooling recommendation — the input a payback estimate needs. The machine figure and the channel count are the only two costs the model takes from the supplier side; everything else — your wage, volume, lens cost and current rejection rate — stays on your side of the table.
Run the test before you have committed to a supplier, not after. The 48-hour run with 500–800 lenses costs a shipping box and a few days, and it either confirms the rate you need or shows that a different channel count or tooling would be required to reach it.
Both outcomes have value: the first is a decision made on data, the second is a decision made before the capital was spent. Where a line already feeds automatically and the complaint is quality rather than speed, the same test works as a diagnostic, because the rejection breakdown identifies whether the cause is the track, the tooling or the lens batch itself.
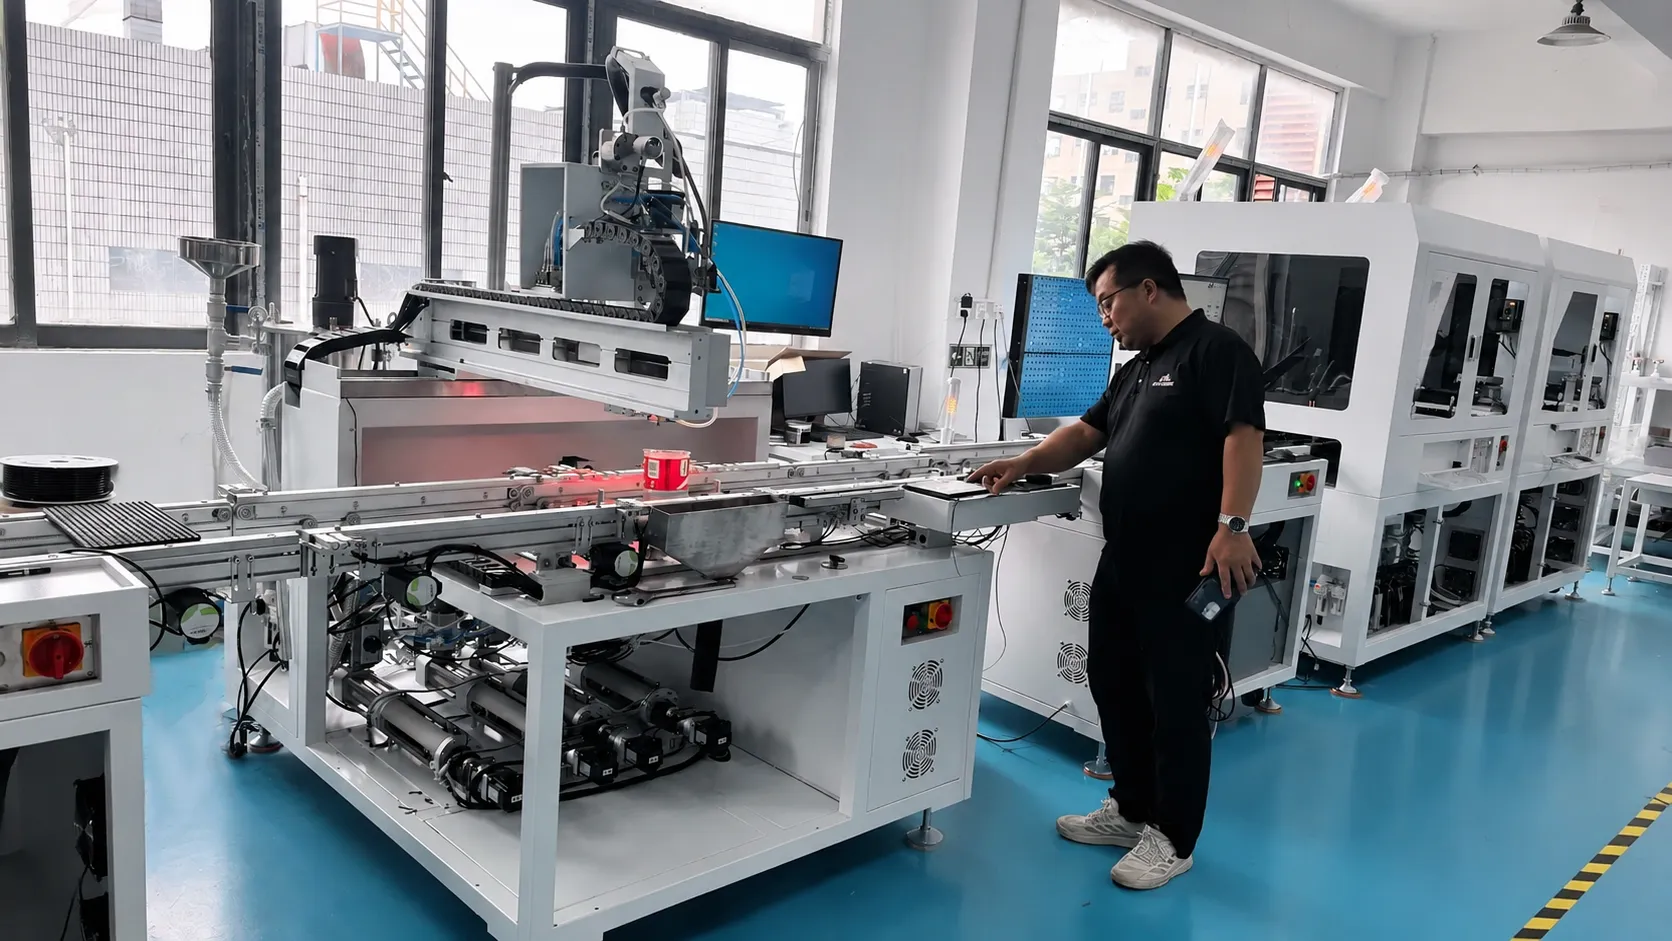
Automation changes the failure mode of a feeding step, and the first month is where that change becomes visible. In the manual arrangement, quality depends on how tired the operator is, so the risk grows through the shift; on a controlled feeder the presentation rate is owned by the drive and the tooling, so the risk moves to configuration and to the lens batch.
Expect the first days to be spent on three tasks: confirming the presentation height against the nozzle stroke, loading the lens recipes into the PLC so a changeover is a recall rather than an adjustment, and settling the tooling on the actual production lenses rather than the tested samples. Operator training runs one to three days on the multilingual HMI; add a session on rejection handling, where a new operator can reintroduce variability.
Measure three things through the first month and write them down weekly: feed rate against the requirement, rejection with its cause breakdown, and shift-to-shift variation. The third is usually missing from indicators because a manual line hides it — a night shift running 40% higher rejection than the day shift on the same part is common and rarely appears on a shift report.
A controlled feeder should hold variation under 3%; where it does not, the cause is normally tooling related rather than drive related, which means the fix is mechanical and specific. The last item is discipline: resist re-tuning the machine every time a lens batch looks difficult — a feeder adjusted by three people in a fortnight has lost the comparability that made the sample test useful.
Between a fully manual station and a fully automatic feeder sits a semi-automatic arrangement, and for some factories it is the right answer rather than a compromise. A semi-automatic cell typically runs 1,500–2,500 UPH with rejection in the 2–5% band, needs one or two operators per line, and changes over in 10–20 minutes.
Against manual feeding it removes the orientation judgement while keeping the operator in the loop for loading and inspection. It fits production where the lens changes several times a day and volume per type is modest, because it does not require tooling per lens type to the same depth. It also fits plants whose bottleneck is not feeding: if the placement machine is limited by something else, a faster feeder buys a longer queue.
High-mix work is where the arithmetic is genuinely two-sided. On the automatic side, tooling is built per lens type and changeover under five minutes with PLC recipes is what makes a mixed schedule viable; on the manual side there is no tooling to amortise, so any lens can be run tomorrow without a preparation cost.
The decision therefore turns on how many pieces a lens type will actually run before the design changes. When that number is large, tooling is amortised within weeks and automation wins on quality and labor. When it is small and products churn, a hybrid arrangement is often best: one automatic feeder for the high-volume lens types, and a semi-automatic or manual station for the long tail.
 RelatedDPS-2 Full SpecificationsDPS-2 Full SpecificationsView product →
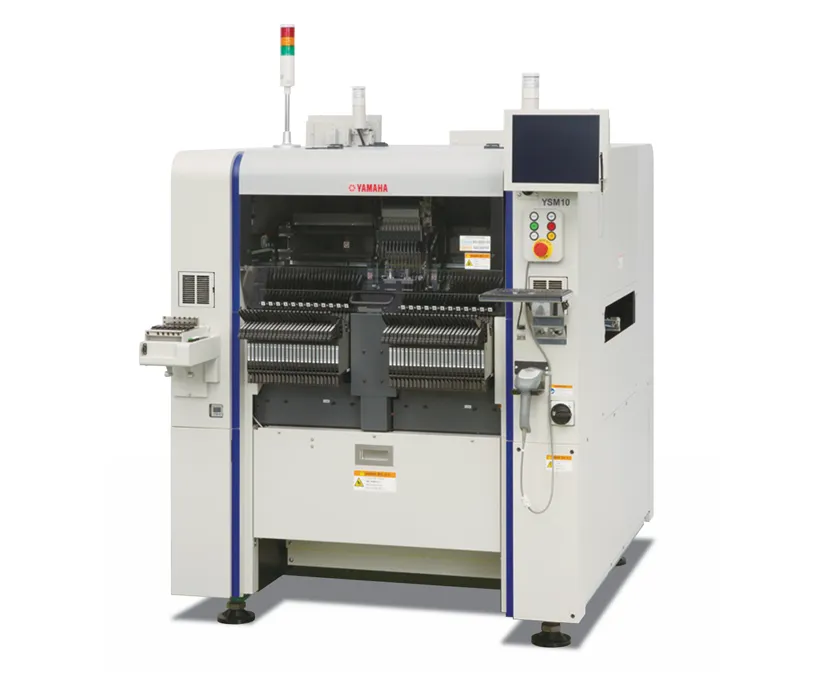 CompanionYamaha YSM10 MounterHigh-speed compact modular mounter – 46,000 CPH, 96 feeders, e-Vision + Side View.View product →
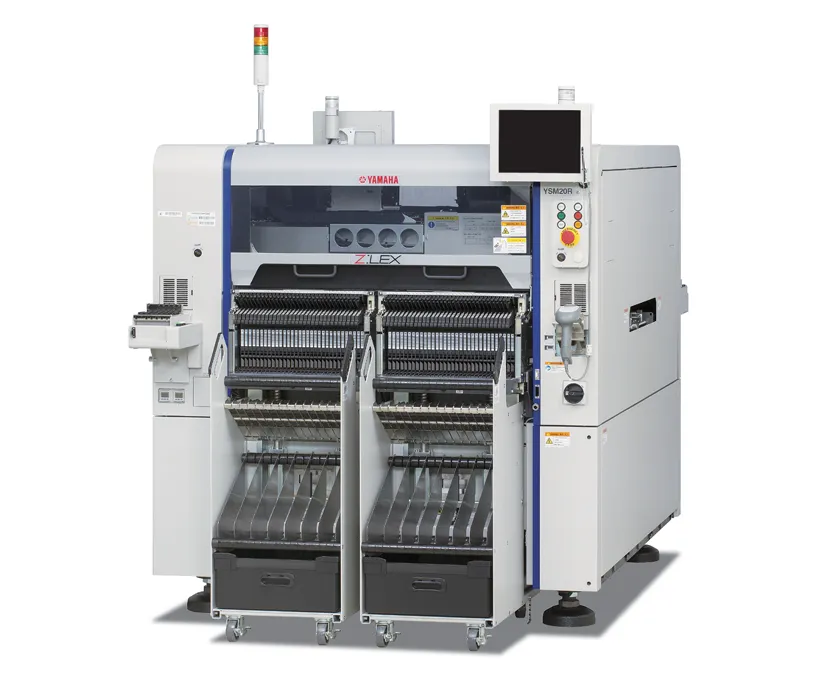 Yamaha YSM20R Pick and Place95,000 CPH modular mounter — pairs with DPS-2 lens feeding lines.View product →
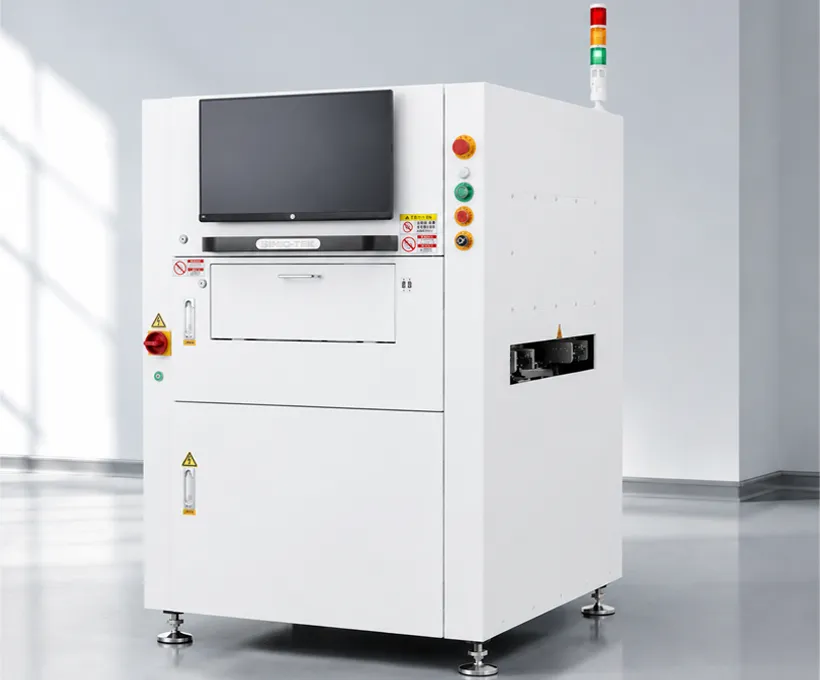 3D SPI Solder Paste InspectionCatch printing defects before reflow with 100% 3D paste inspection.View product →
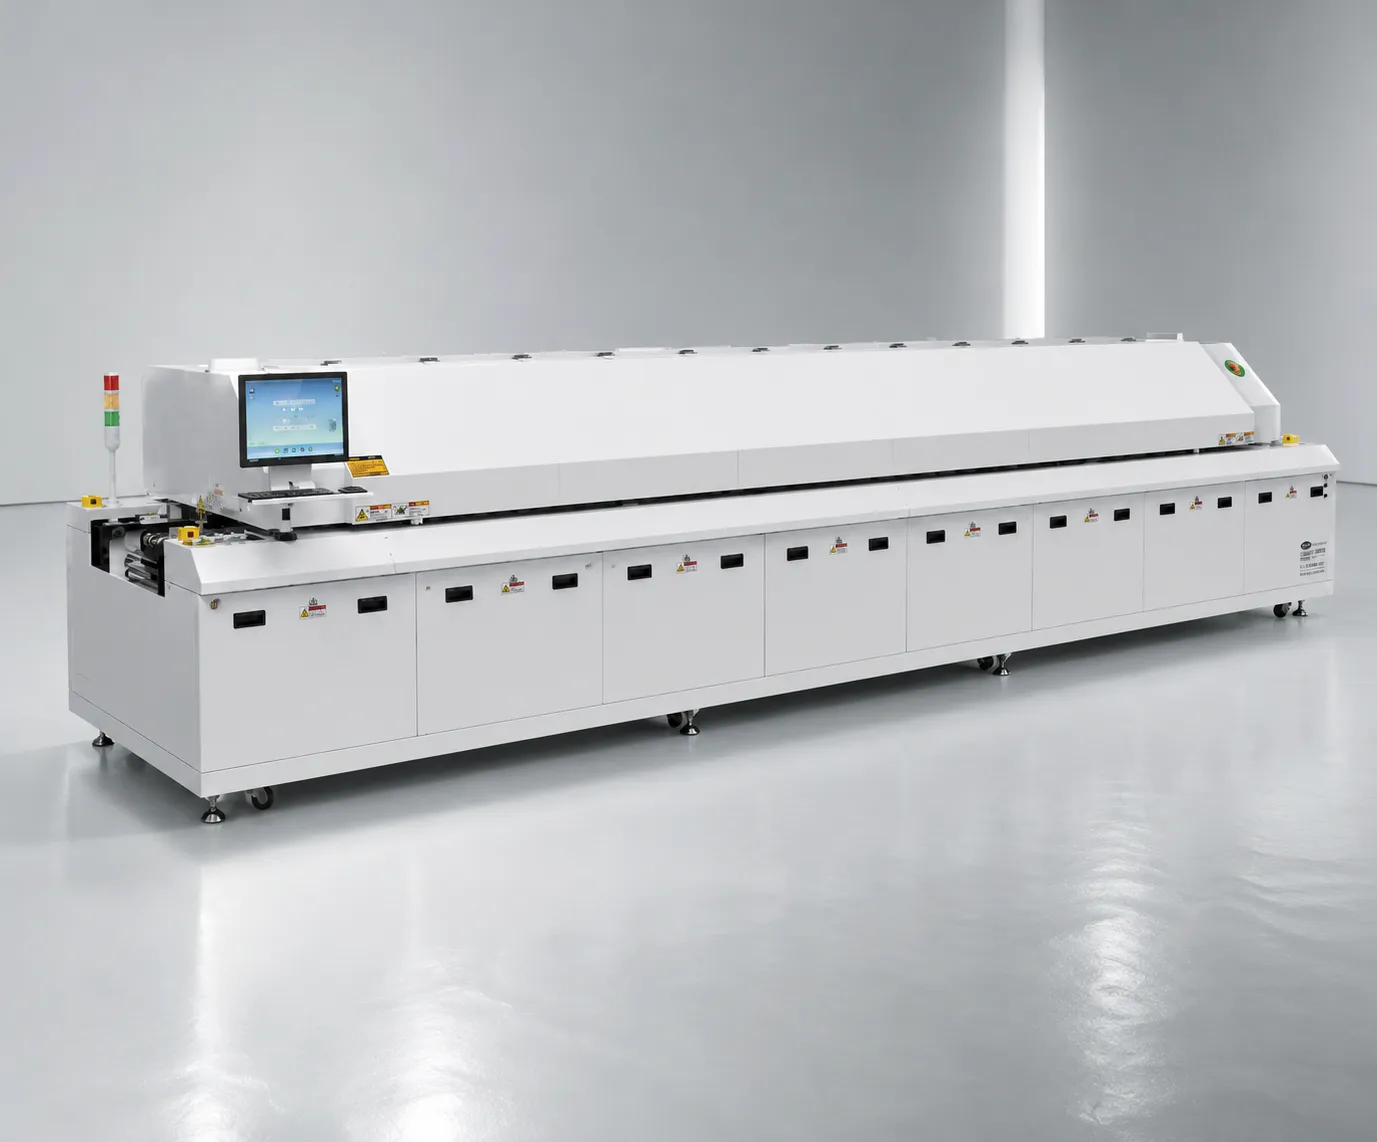 R10 Reflow OvenLead-free hot air reflow with stable thermal profiling for lens assemblies.View product →
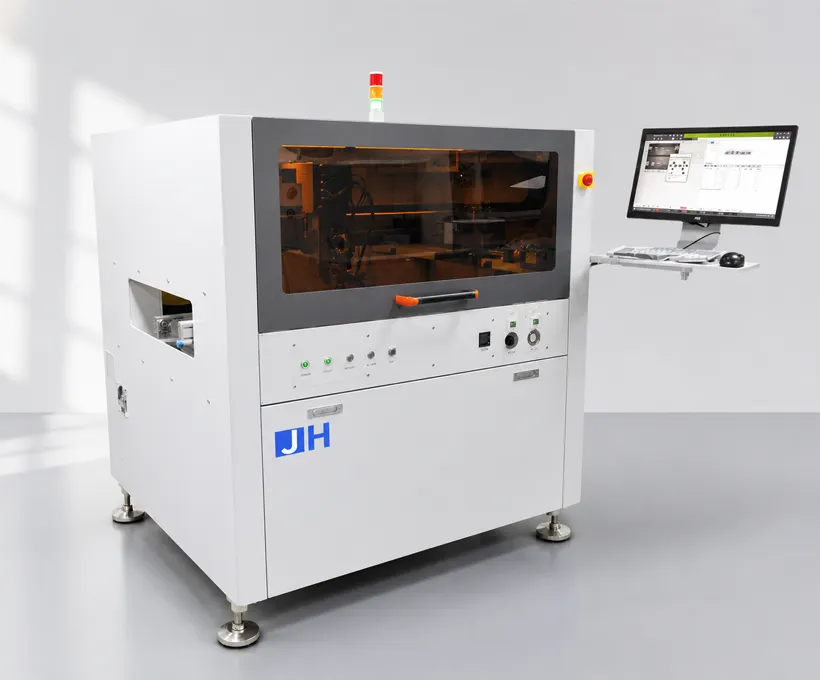 D900 Dispensing MachinePrecision dispensing for conformal coating and lens bonding steps.View product →
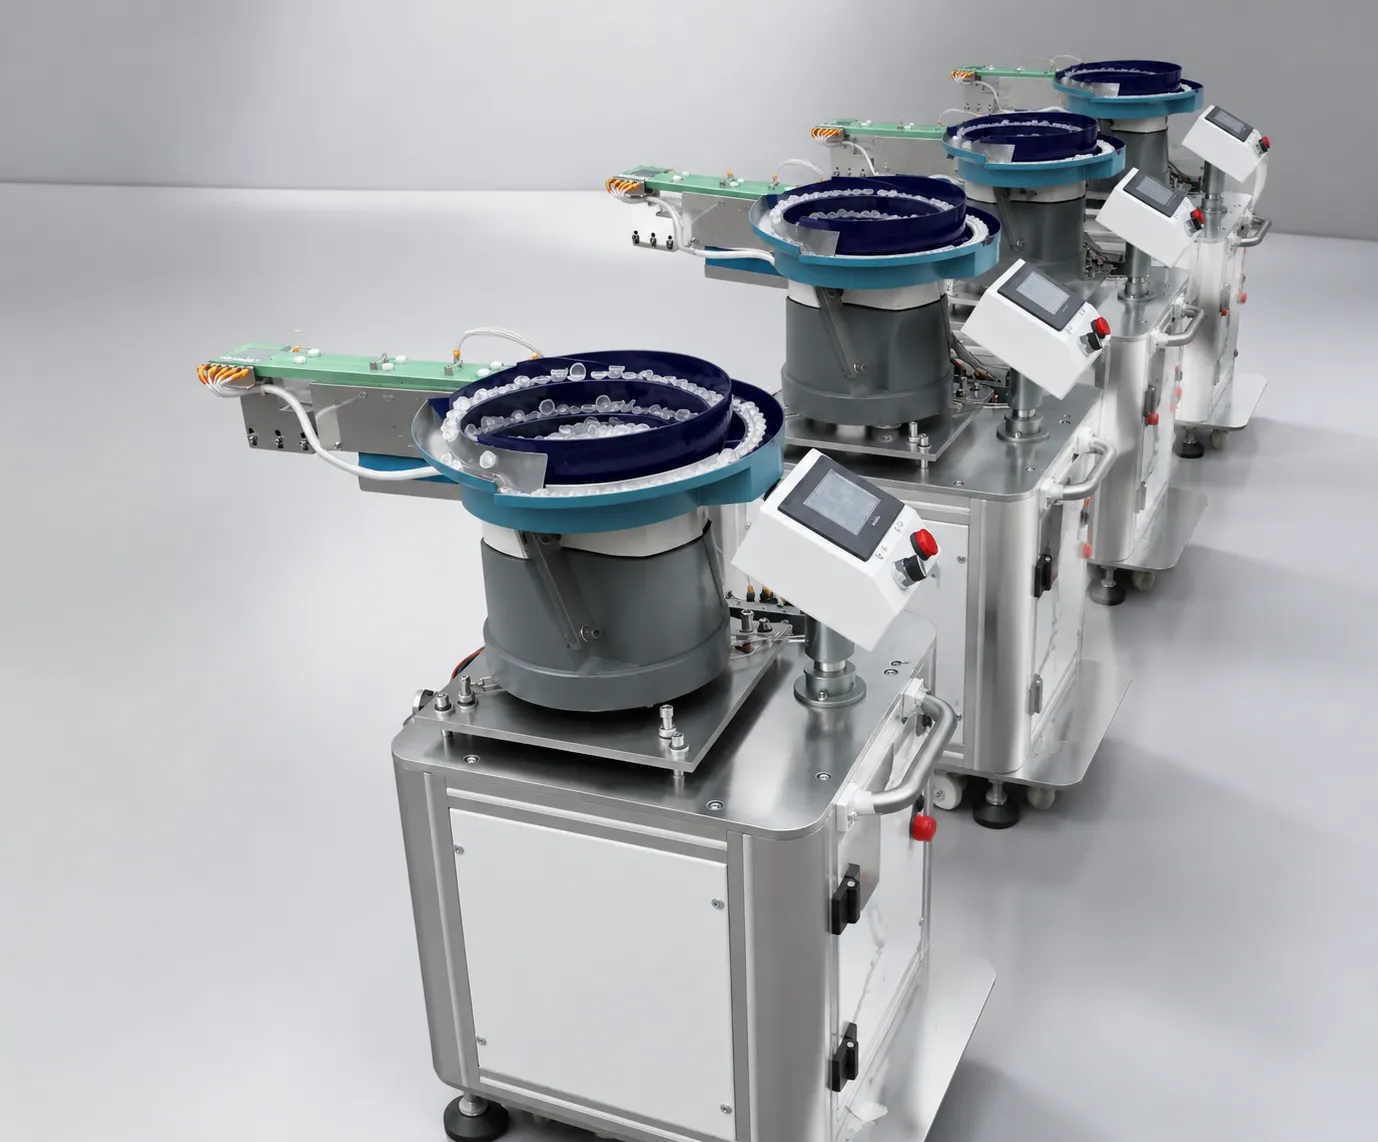 ProductDPS-2 Product KnowledgeArchitecture, specifications, and buyer fit.Read more →SupportDPS-2 Troubleshooting GuideSymptom → cause → fix procedures.Read guide →
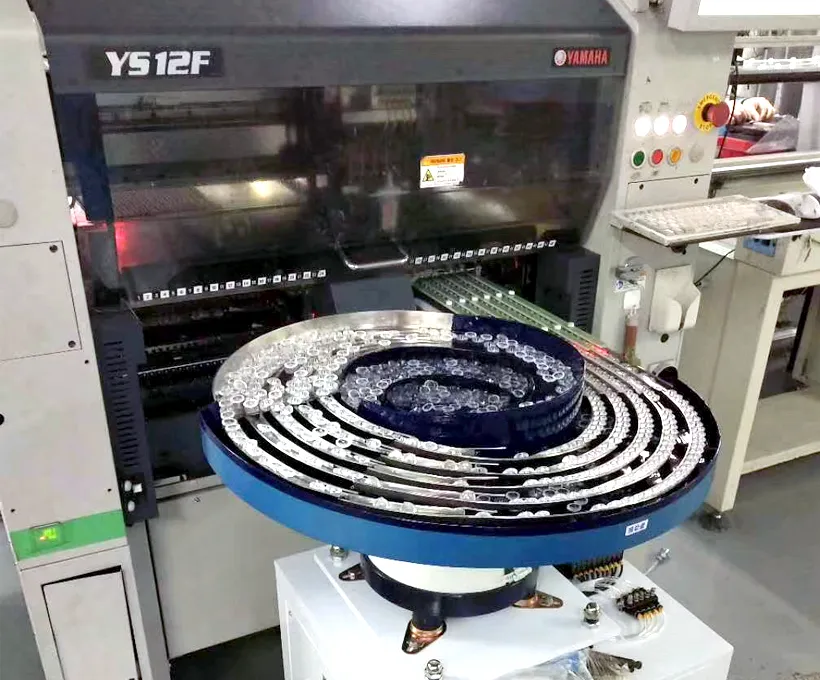 Buying GuideHow to Choose an SMT Lens Feeder (2026)An 8-step buying path, supplier scorecard and dual vs single frequency comparisonRead article →
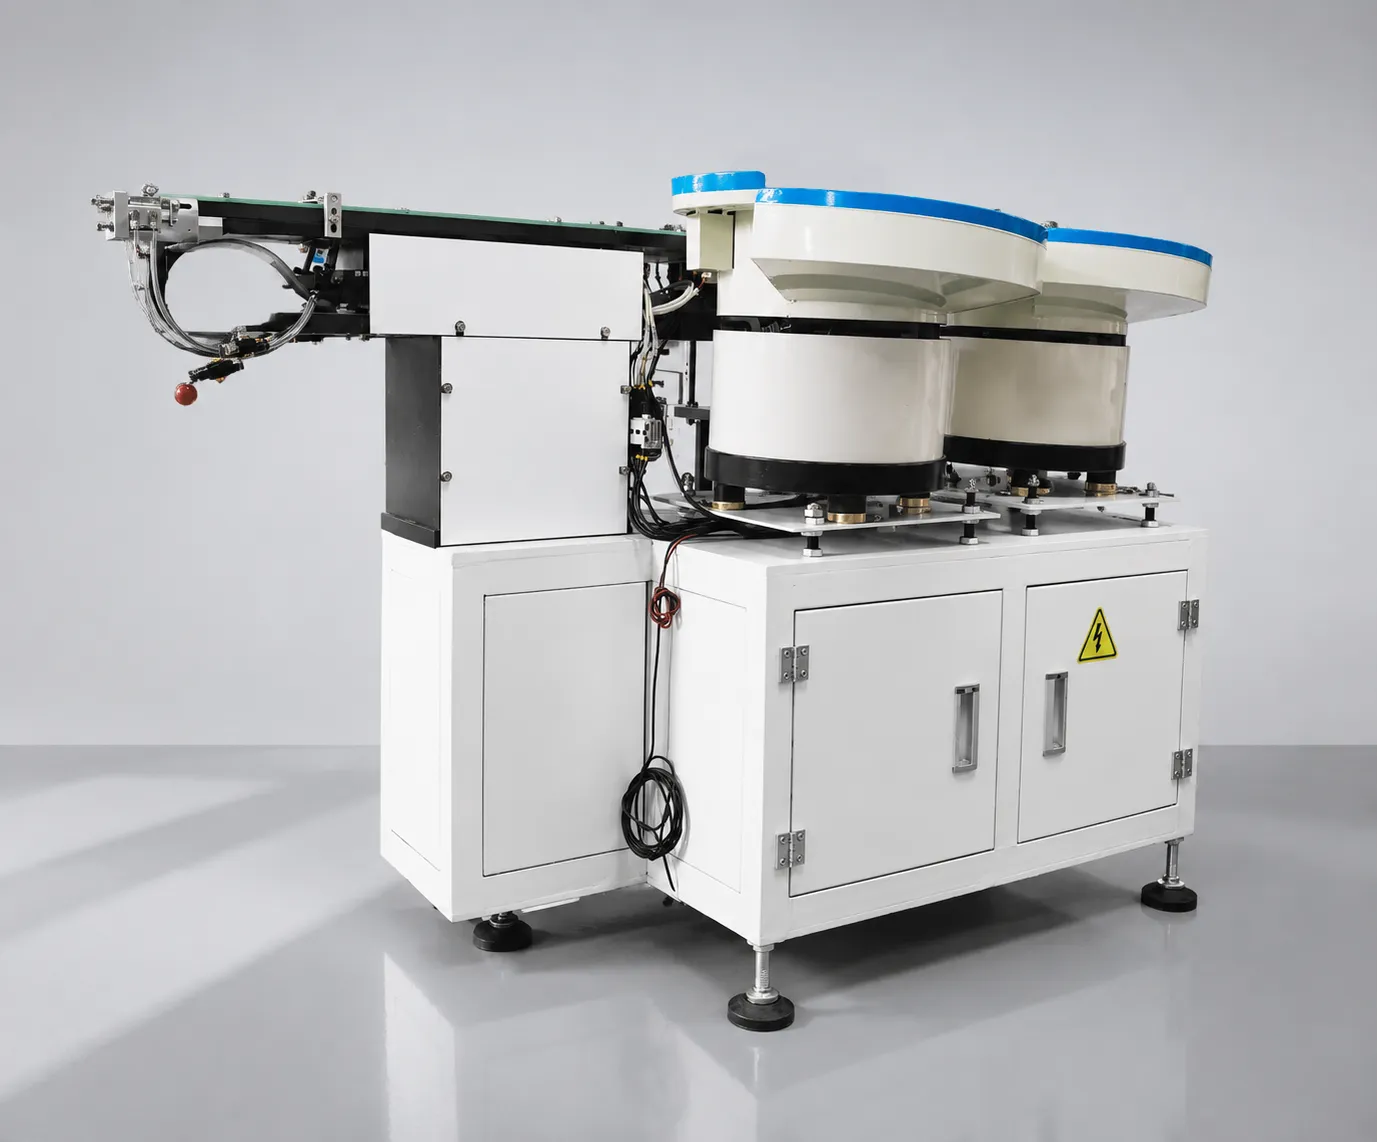 Case StudySMT Lens Feeder ROI Case StudyReal KPI transition: defect rate 12%→0.3%, UPH 900→3420, 7-month paybackRead article →
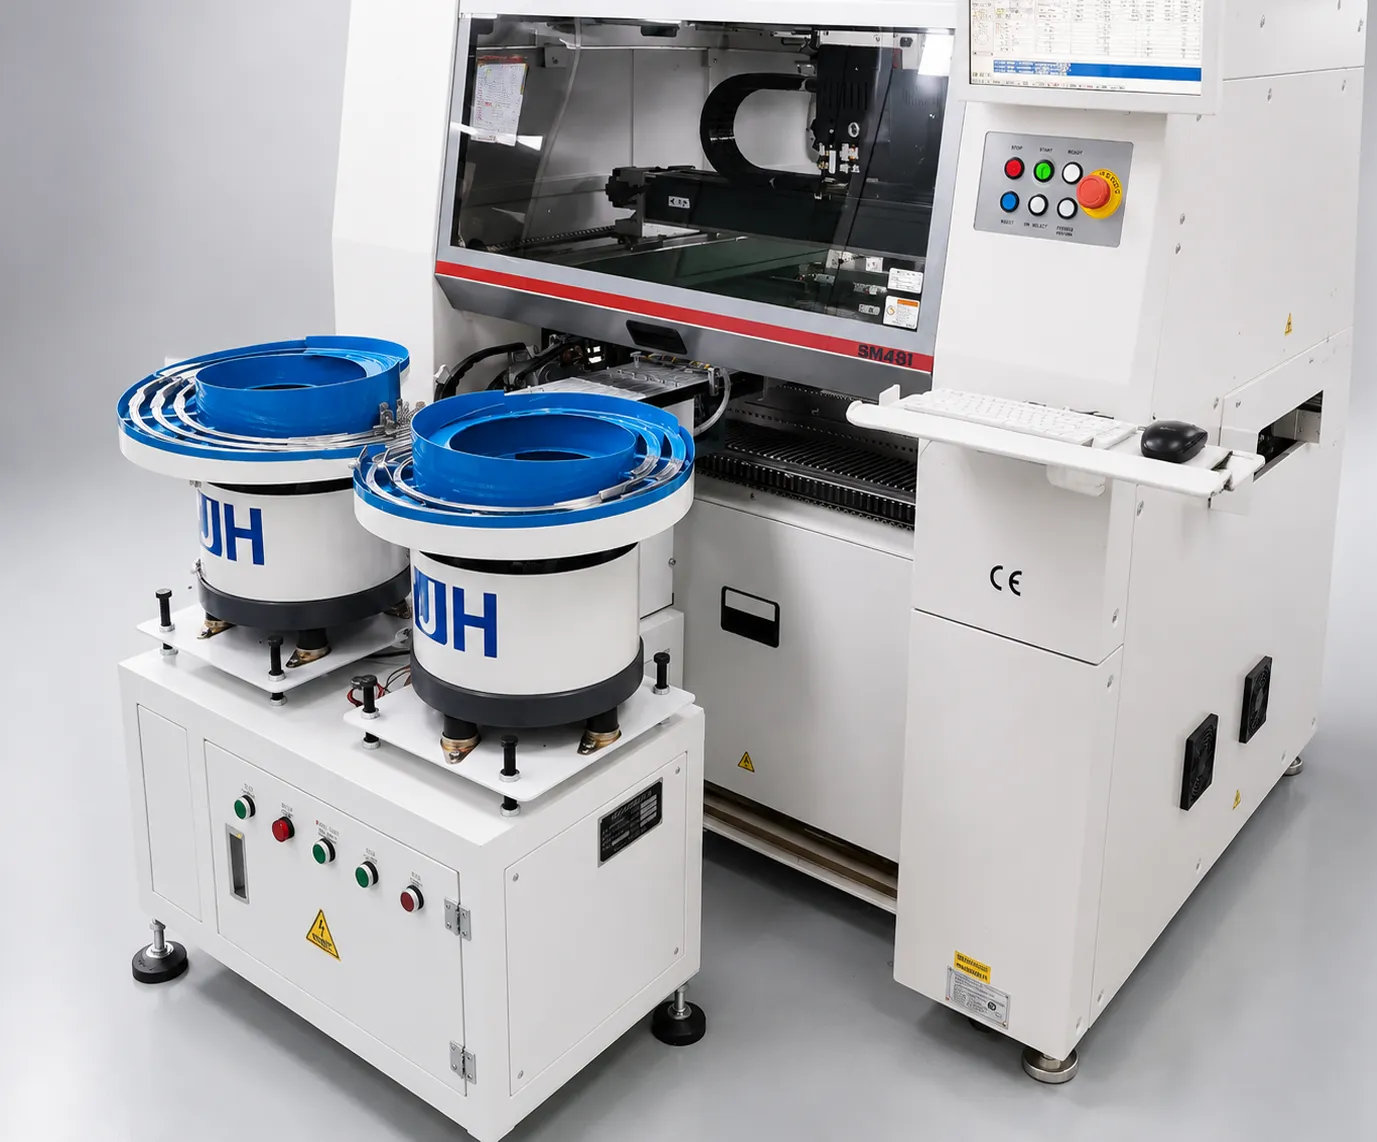 GlossarySMT Lens Feeding GlossaryTerminology for vibratory feeding, PID control, and UPH metrics.Read glossary →
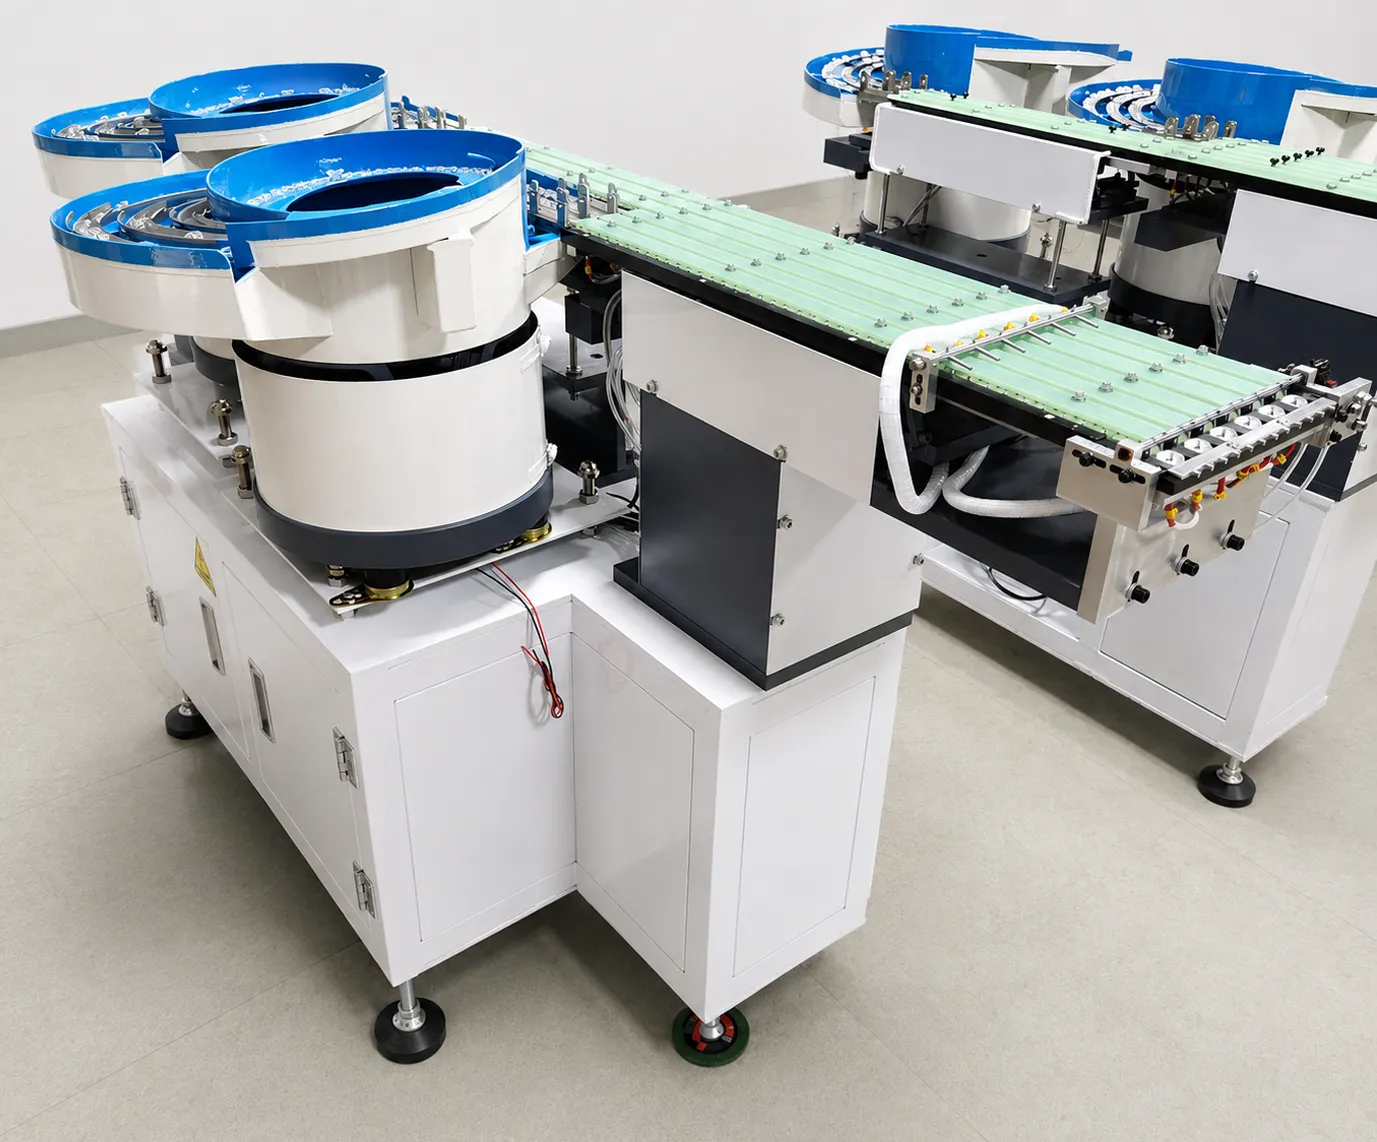 ComparisonDual vs Single Frequency Vibratory FeederTechnical comparison of the two vibration technologiesRead article →
Send your lens samples and production data, and a JHIMS engineer returns a measured test report plus a payback estimate for your line. Standard terms: 70% T/T deposit with the order, 30% T/T before shipment.
To see the difference on real lenses: automatic LED lens feeding on a pick-and-place machine, a vibrating bowl feeder in production, and more line footage on the JHIMS YouTube channel.